Honest measurement
We describe what our software actually measures, and where the limits are. Frequative reports relative levels from the Android audio pipeline — we do not dress that up as calibrated instrumentation.
Independent software studio
We build focused, carefully engineered tools for Android. Our first product is Frequative — a real-time audio spectrum analyzer.
The studio
Lelaris Labs is a small independent studio. We would rather ship one tool that behaves correctly under load than a suite of features that look good in a screenshot.
We describe what our software actually measures, and where the limits are. Frequative reports relative levels from the Android audio pipeline — we do not dress that up as calibrated instrumentation.
Real-time analysis leaves no room for dropped frames. We profile on ordinary mid-range hardware rather than assuming a flagship device.
Frequative contains no analytics SDK, no trackers and no advertising. The app makes no network requests of its own — audio is analysed on the device.
The product
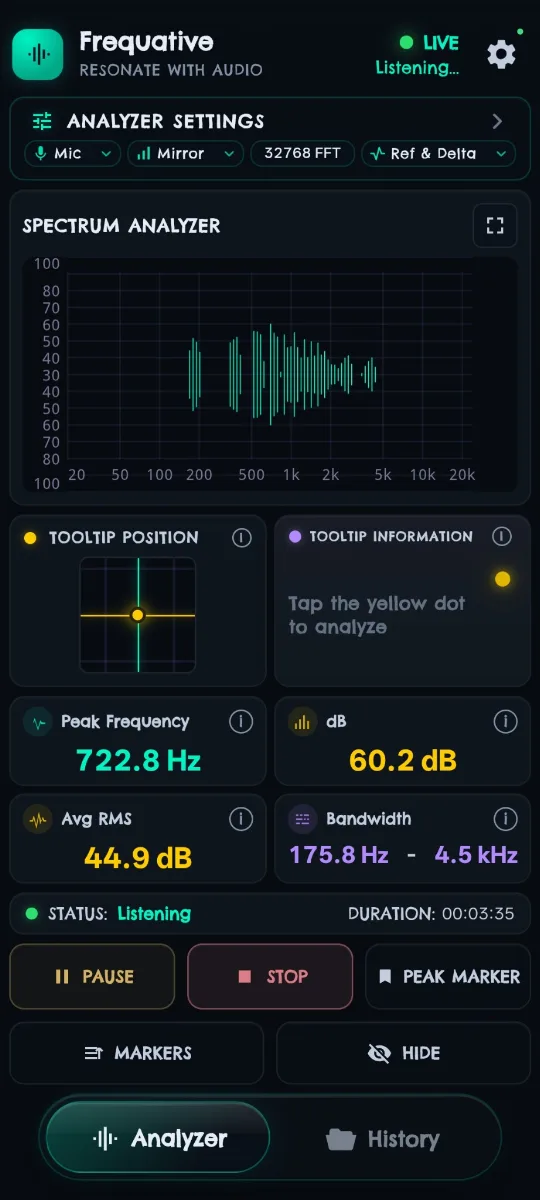
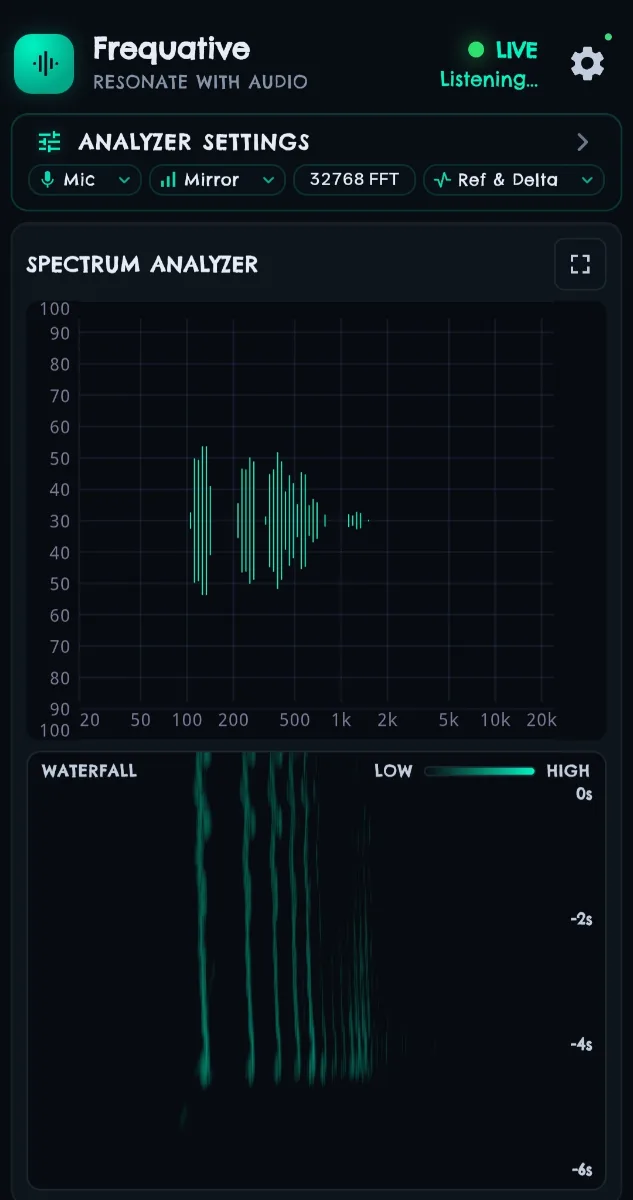
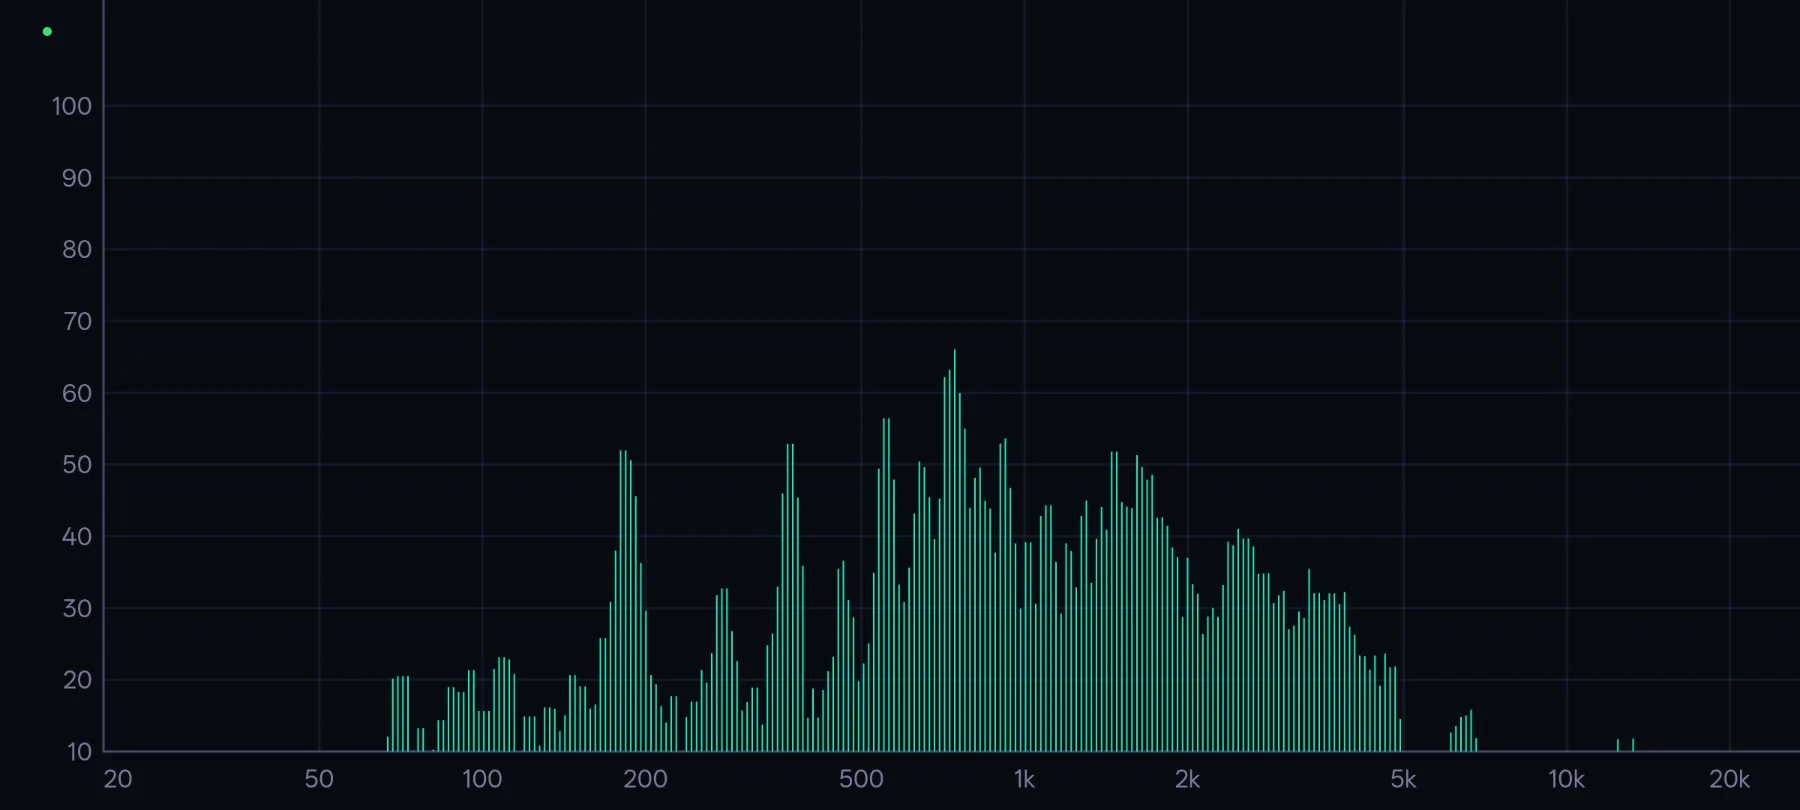
A real-time audio spectrum analyzer for Android. It takes live audio, runs an FFT, and draws what is actually there — with controls precise enough to be useful and restrained enough to stay readable.
Analyse the room through the microphone, or capture System Audio directly from playback on supported Android 10+ devices. System Audio captures the audio stream only — never screen pixels — and the microphone contributes nothing while it is active.
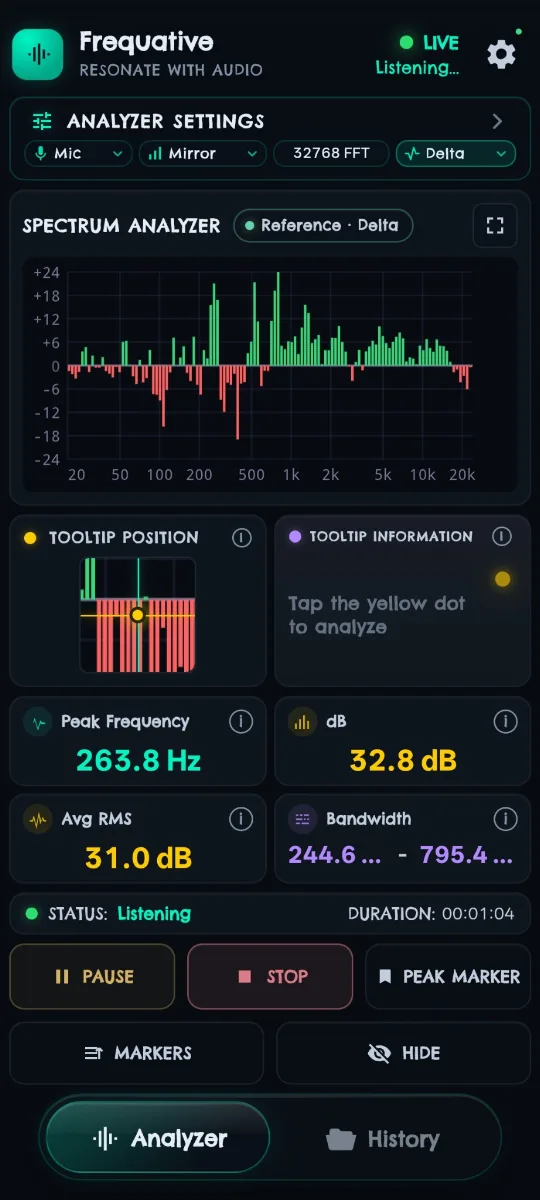
Freeze a Reference spectrum and hold it as a baseline. Compare live audio against it as a ghost overlay, or switch to Delta to read the per-band difference directly.
Capabilities
In the app
Why we build it
Most consumer audio visualisers are decoration. They smooth aggressively, invent detail the signal does not contain, and give you no way to check your own reading.
Frequative goes the other way. The controls that shape a measurement are exposed rather than hidden, a frozen Reference stays frozen, and where the platform limits what can be measured we say so instead of guessing.
Get Frequative
Frequative runs on Android. Full details of what is included, and what Frequative Pro adds, are on the product page.
Purchase problems, restoring Pro, and troubleshooting.
What Frequative does and does not do with audio and data.
Terms of use covering the software and subscriptions.